VISUAL COMPLEXITY: SPORTS INFOGRAHIC
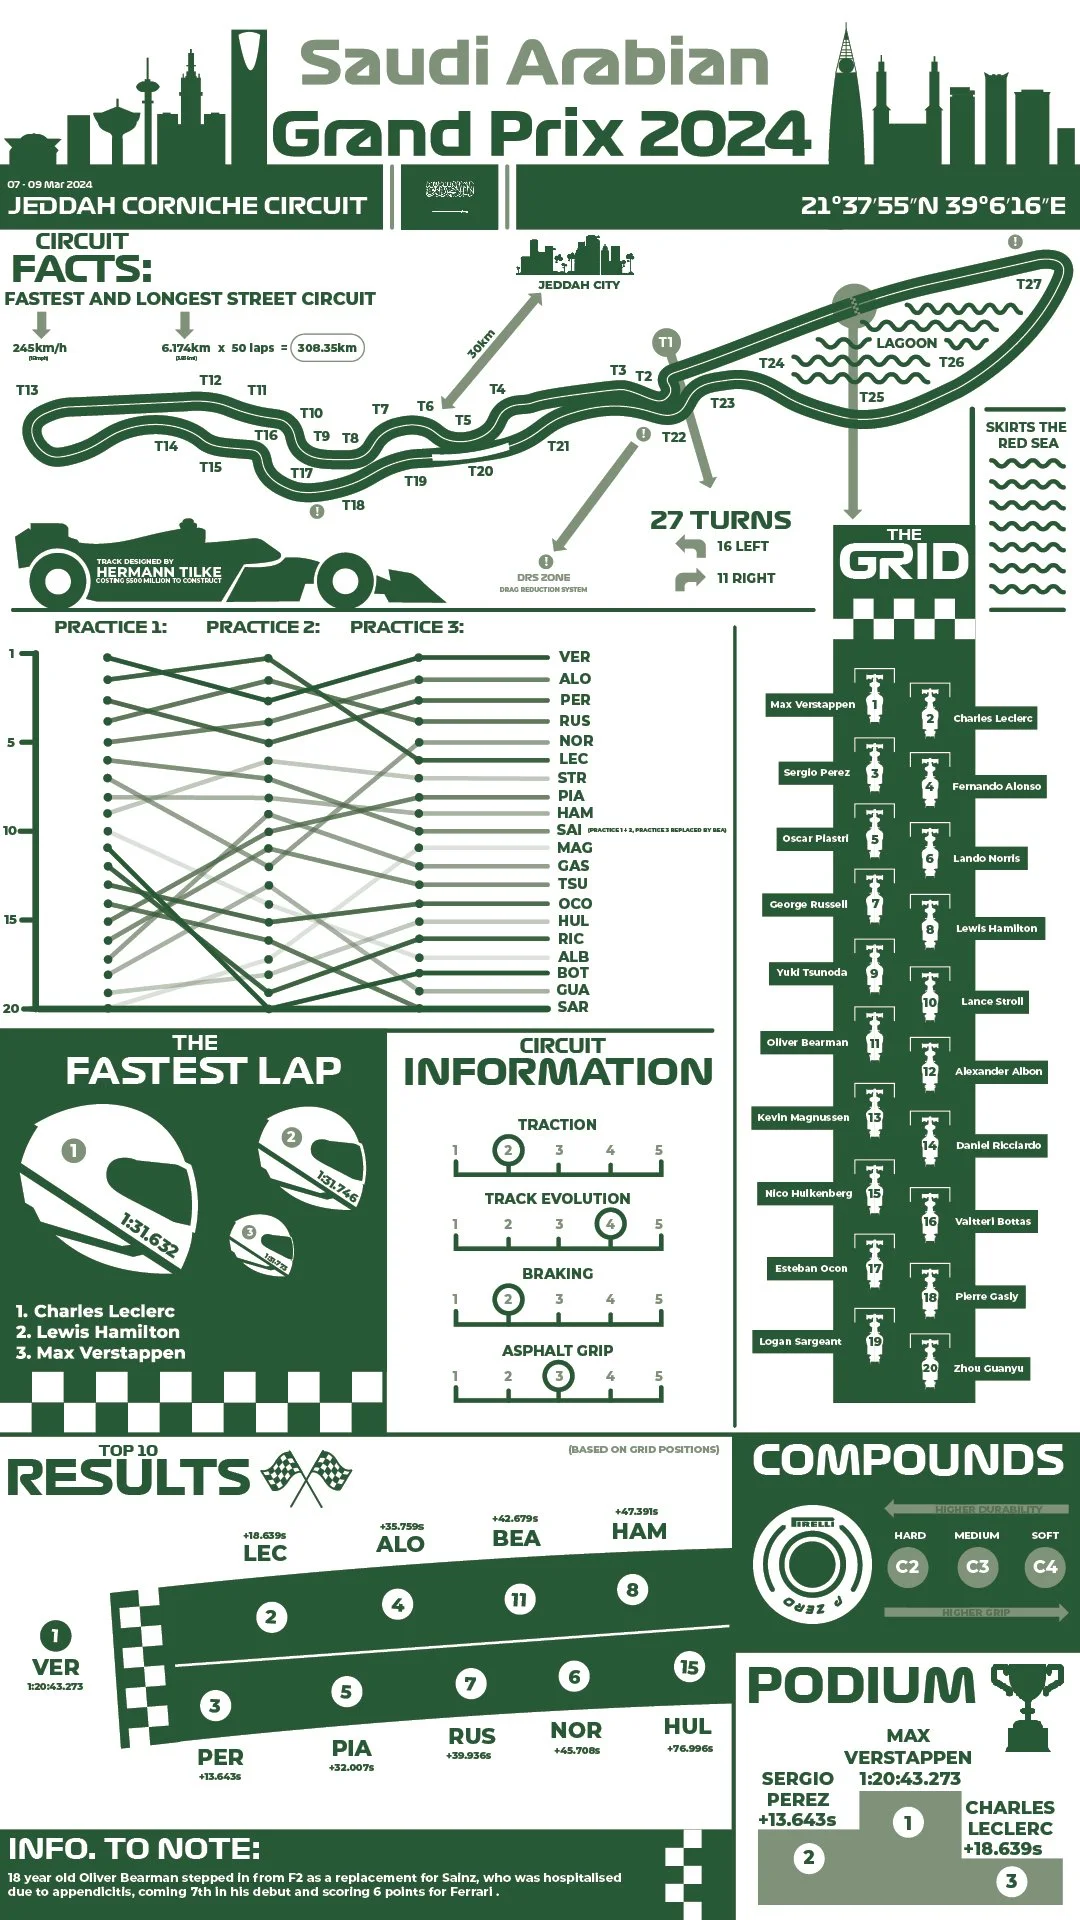
Using 'Information is Beautiful' an independant infographics and data-visuals website, as inspiration, the task was to beautify the clutter of sports data using at least 15 seperate pieces of information. I picked F1 as the sport I wanted to base this project on since I already had an interest in it and it also had a lot of data and statistics available about their races. Furthermore, the Saudi Arabian Grand Prix had just taken place during the time of this project so I felt like it was the perfect race to focus on. My aim for this piece was to display a range of data in a fun yet simple way, using graphics and icons that relate back to the sport.